


Dashboards
Comprehensive Network Visibility with Built-In Grafana Dashboards
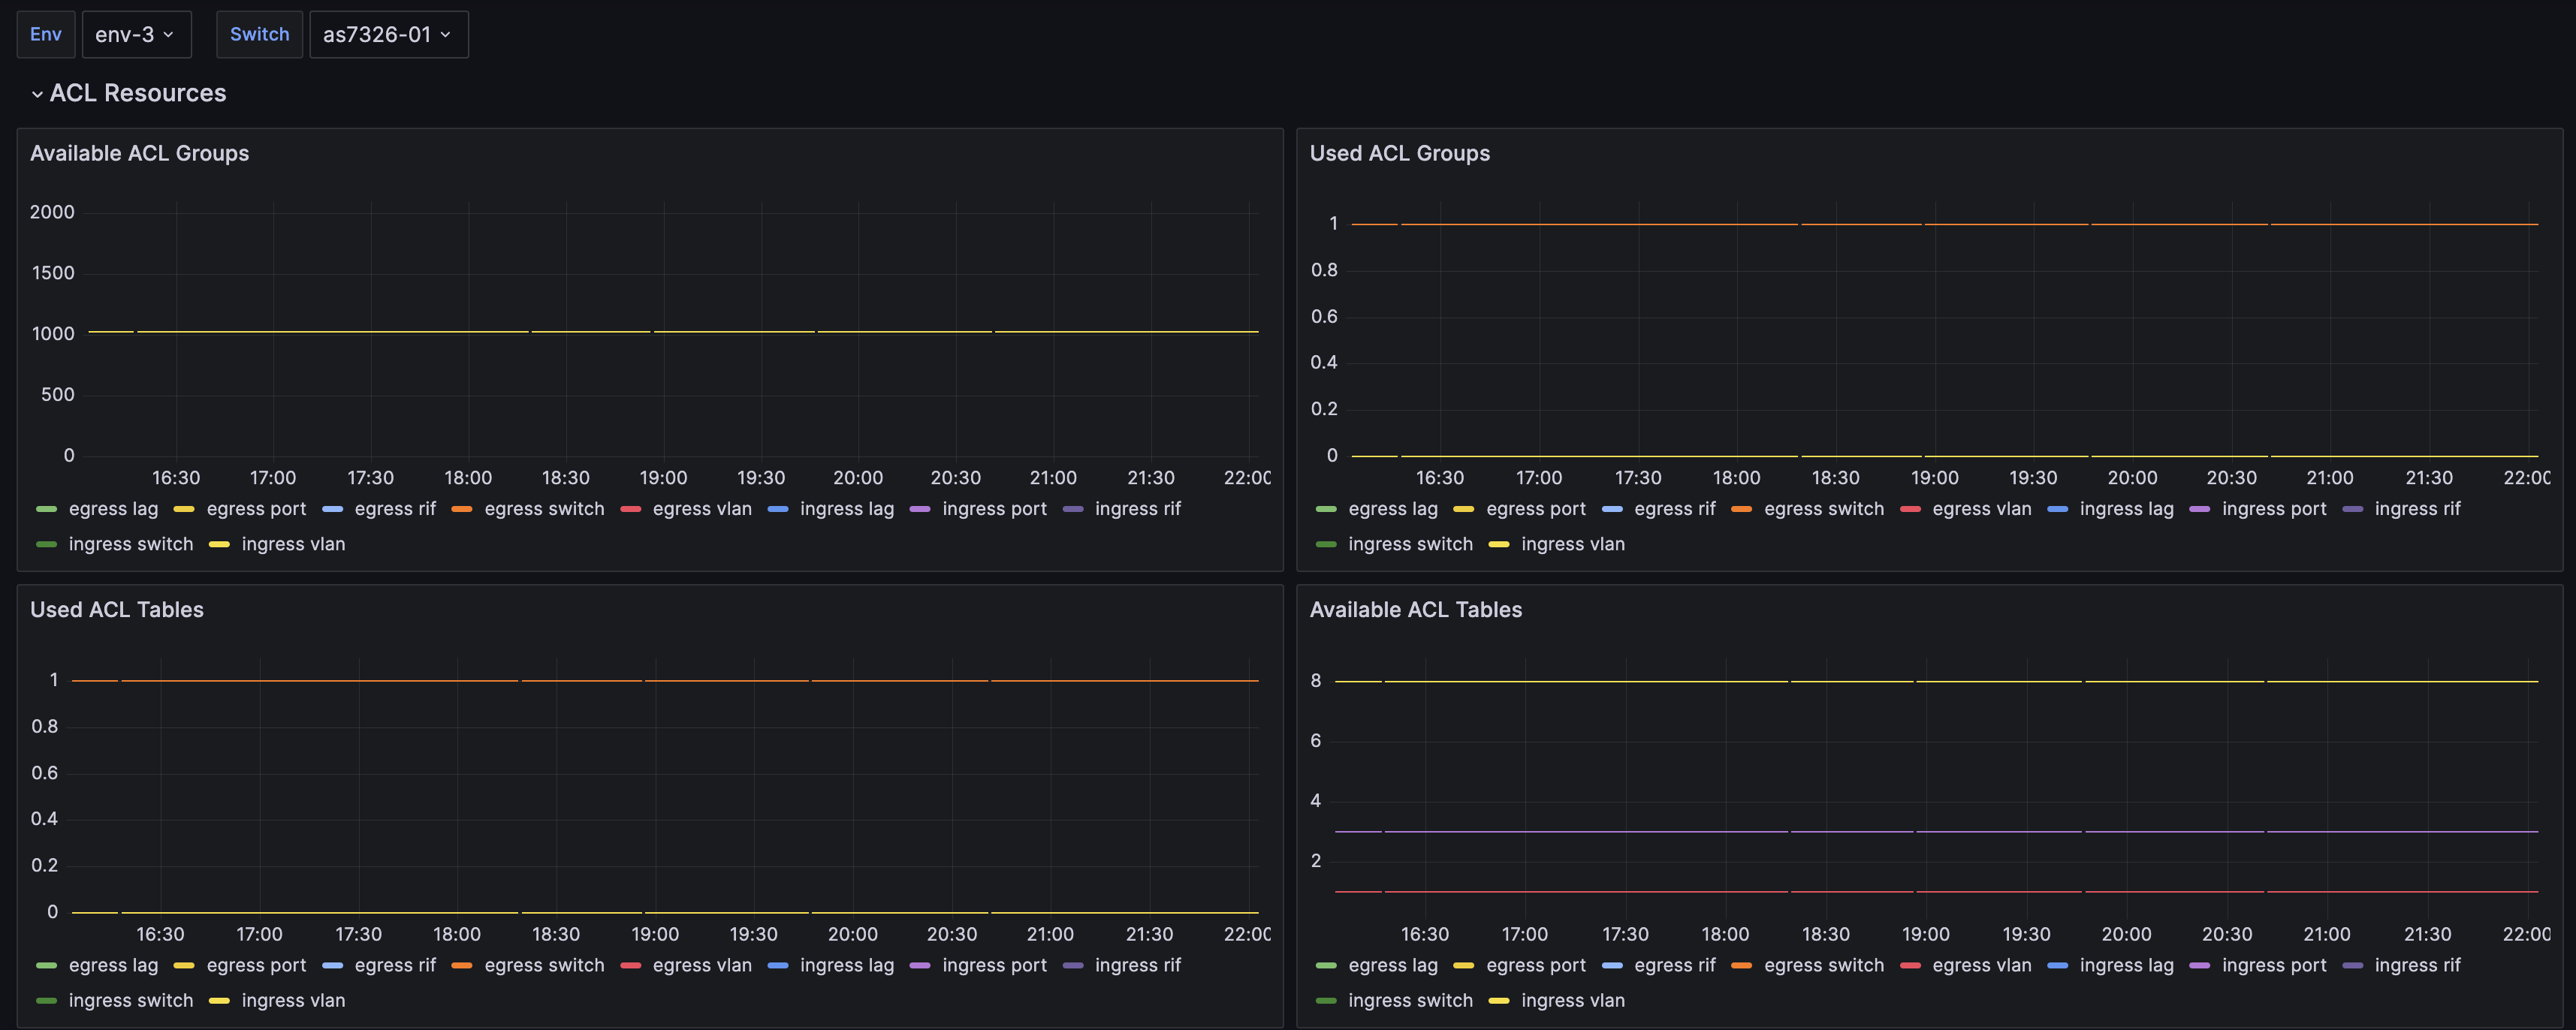
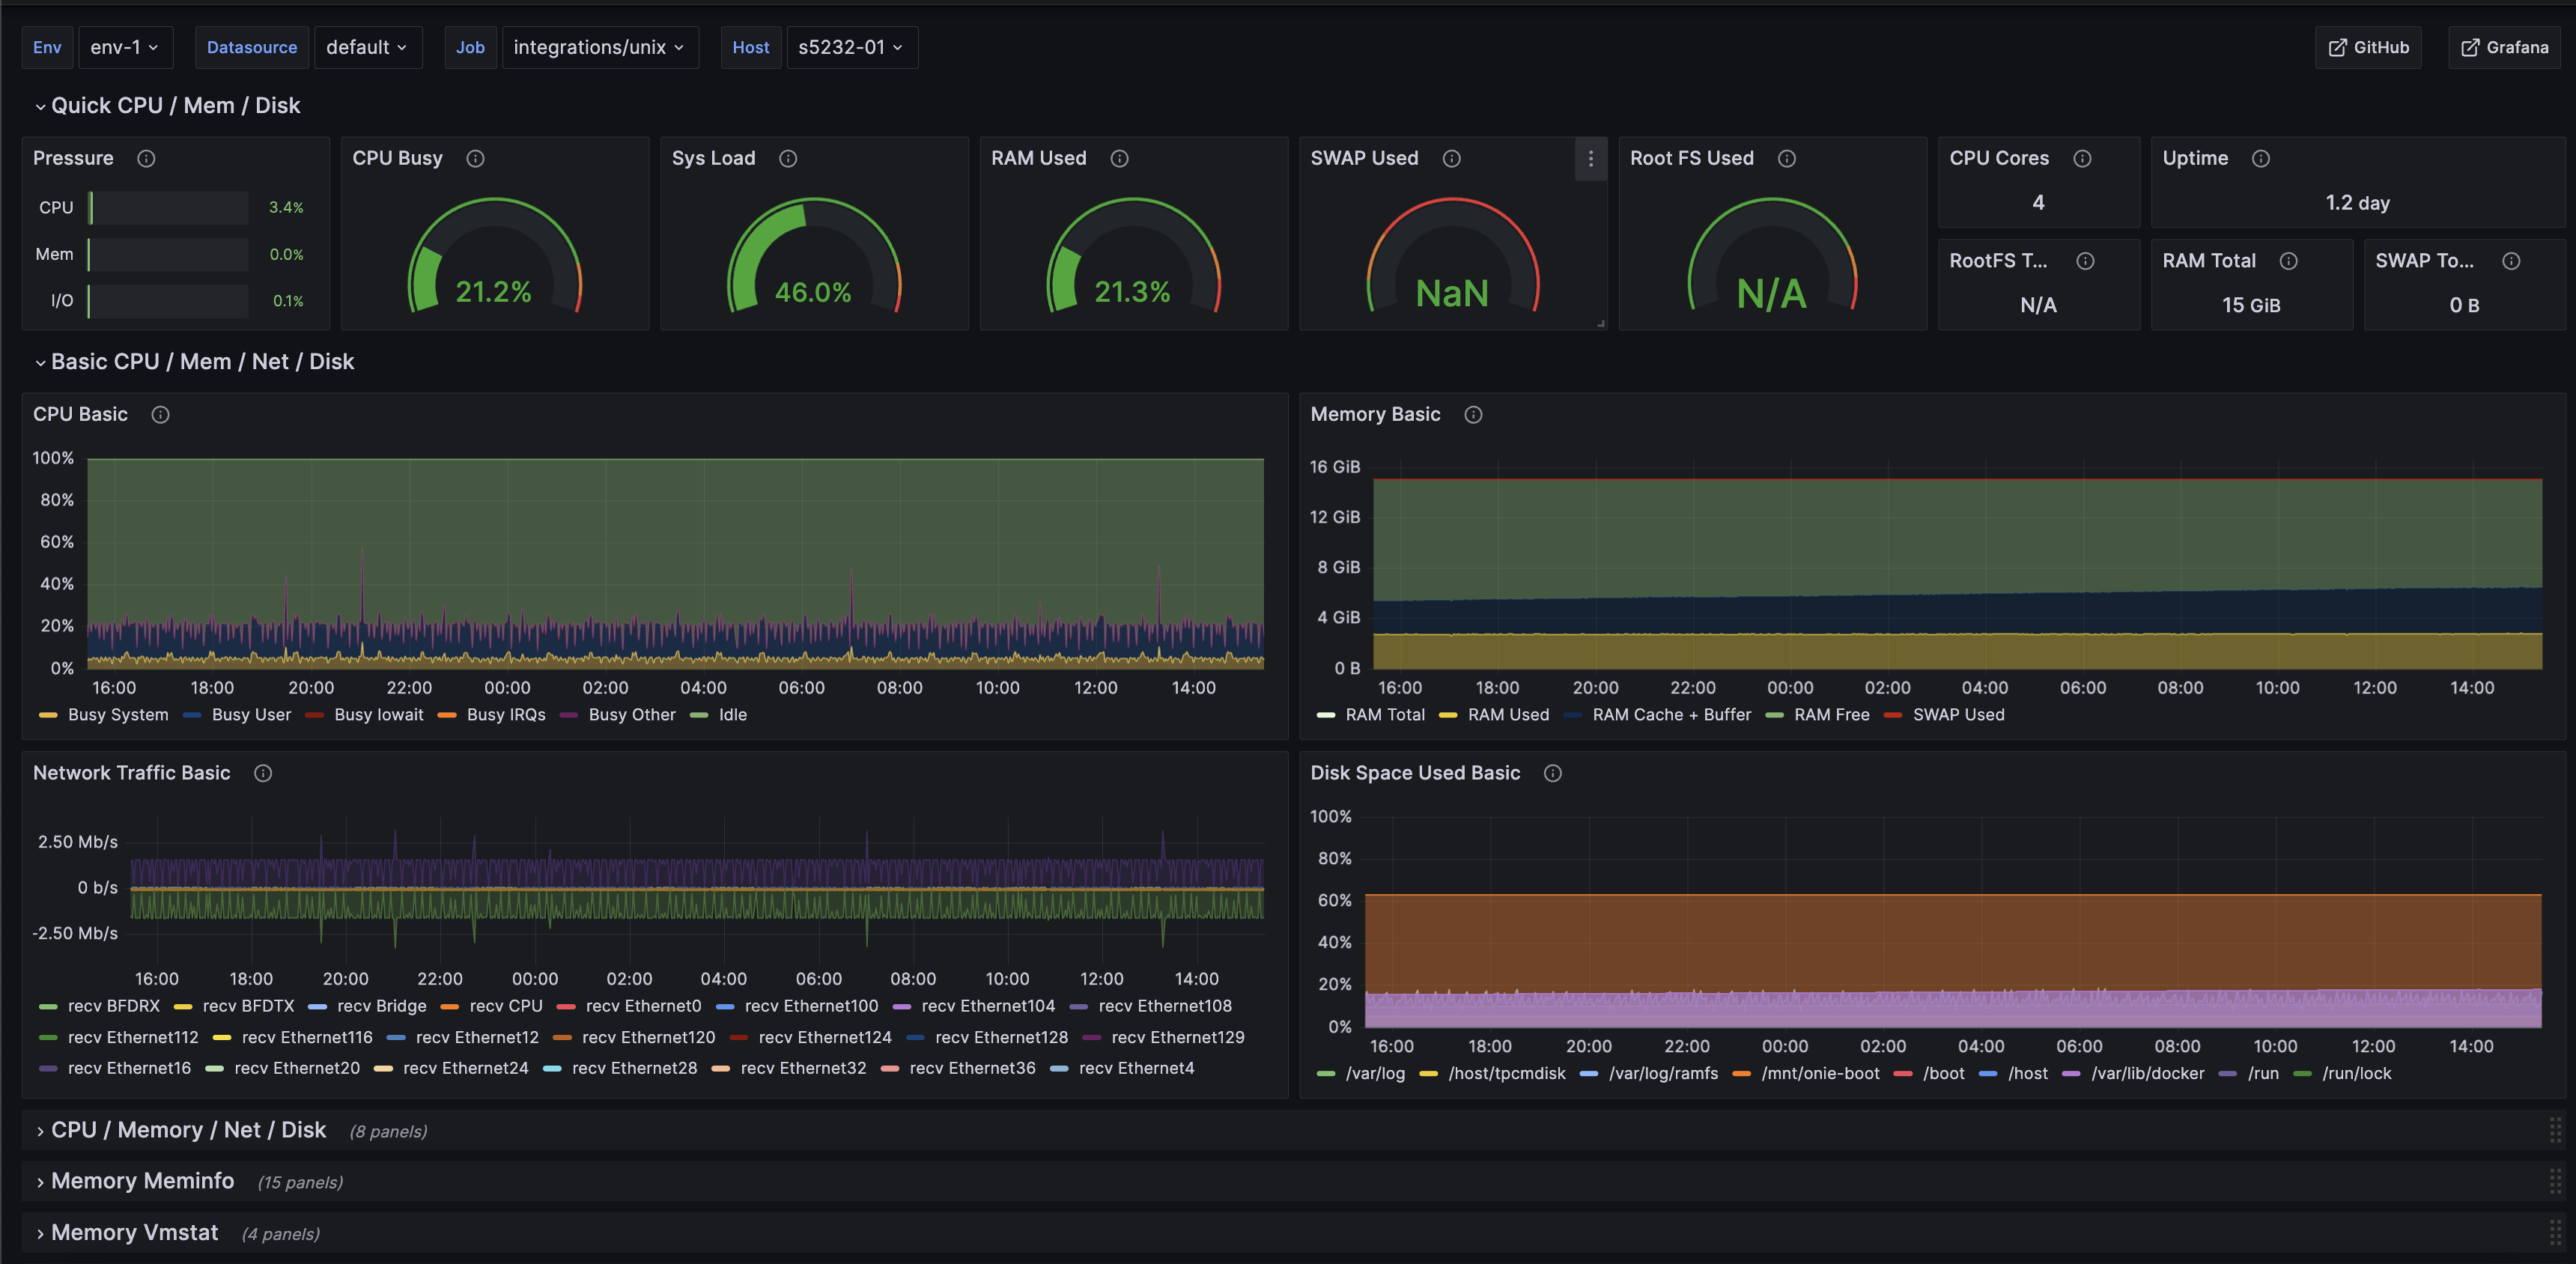
Hedgehog includes network observability dashboards out of the box. Our software appliance includes Grafana dashboard templates for network resources, fabric, interfaces, logs, switch platform, and linux platform metrics.
Telemetry Collection
Unified Telemetry Collection with Grafana Alloy Integration
To generate dashboards, you need to collect telemetry data from your network. The Hedgehog software appliance includes Grafana Alloy with your download. Grafana Alloy is an open-source telemetry collector developed by Grafana Labs, designed to help unify and simplify the collection of logs, metrics, and traces from various sources. It is essentially a distribution of the open-source project known as OpenTelemetry Collector, combined with features from other Grafana tools like Promtail, Agent, and integrations for Prometheus, Loki, and Tempo.
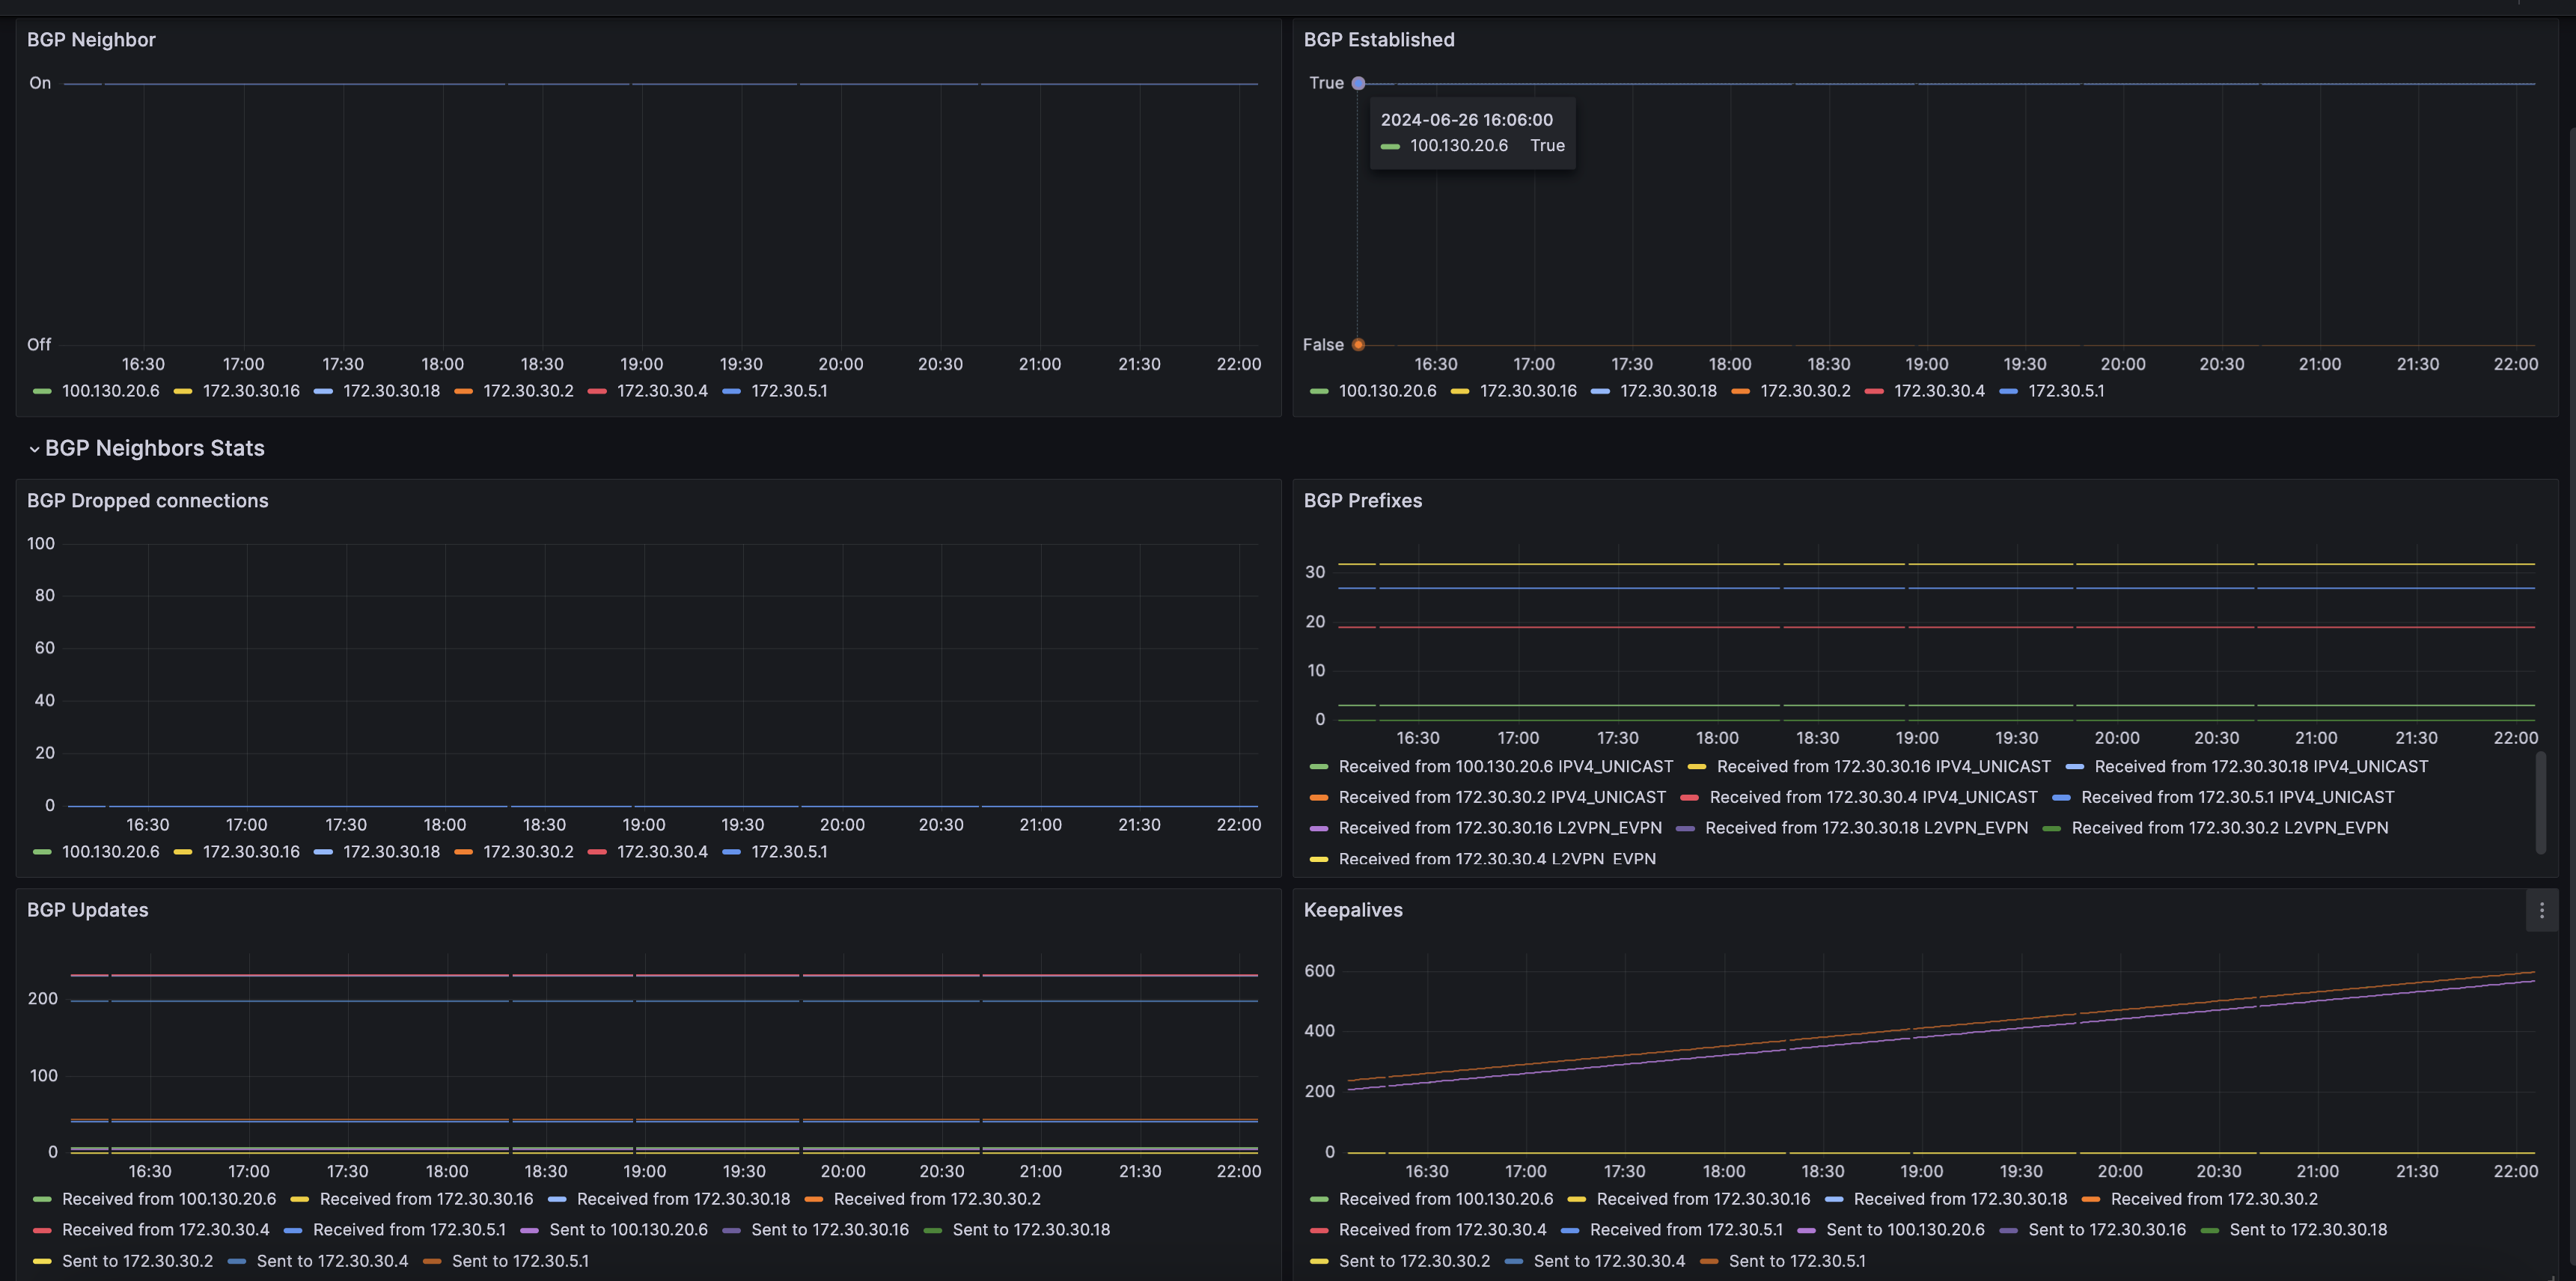
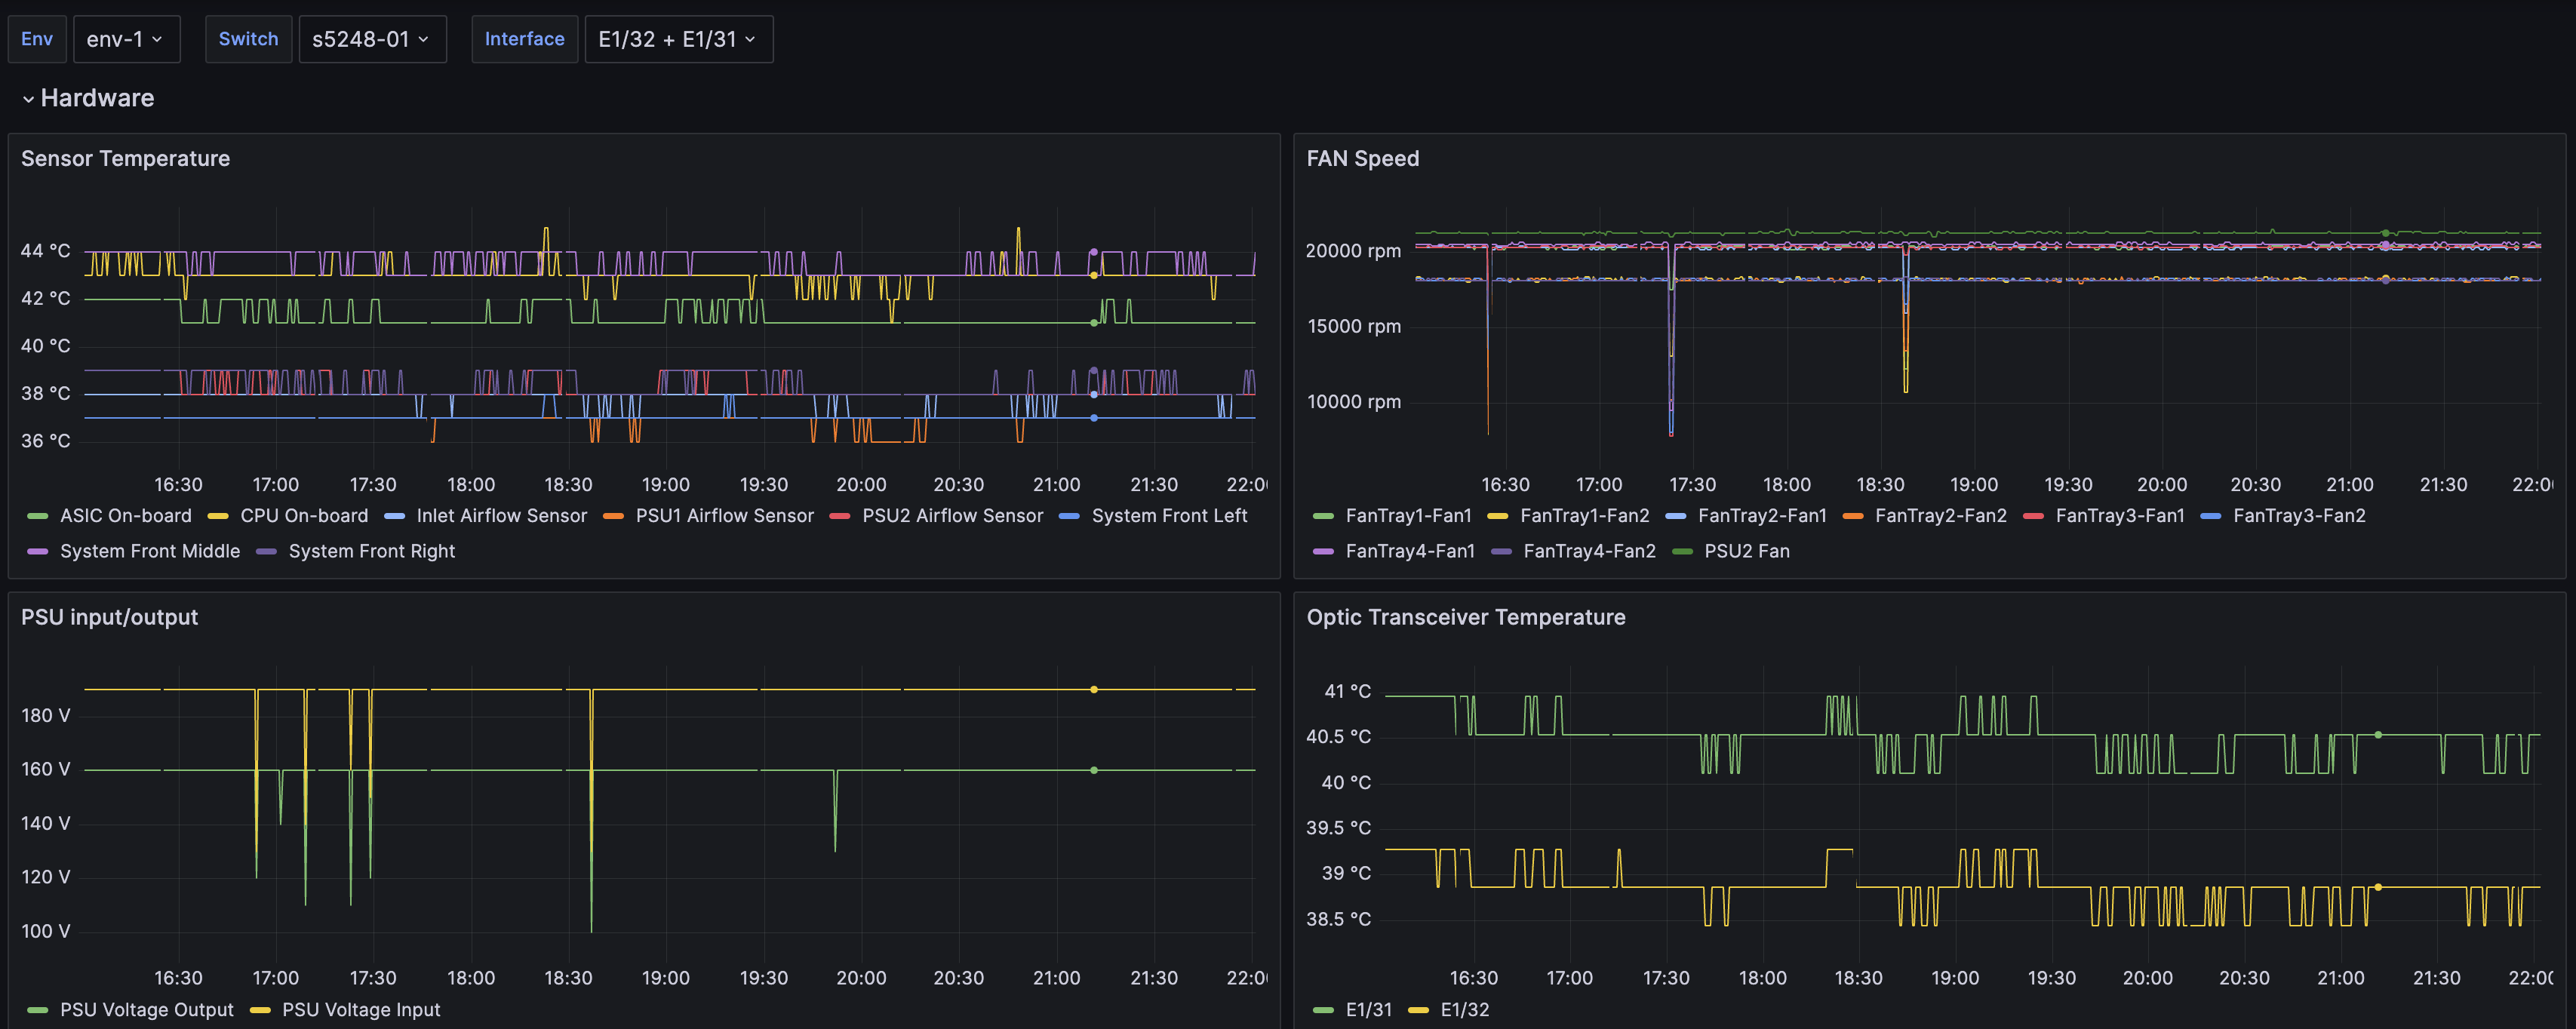
You can use Hedgehog to enable enable Grafana Alloy on your switches to forward metrics and logs to the configured targets using Prometheus Remote-Write API and Loki API. Metrics includes port speeds, counters, errors, operational status, transceivers, fans, power supplies, temperature sensors, BGP neighbors, LLDP neighbors, and more. Logs include Hedgehog agent logs.
You can enable Hedgehog observability any time in your Zero Touch Lifecyle. Like usual, just modify some Hedgehog YAML. Hedgehog will then push logs and metrics to Grafana Enterprise running in your private cloud, or you can use Hedgehog with Grafana Cloud right out of the box.
Logs
Efficient Log Aggregation with Grafana Loki Integration
Grafana Loki is a horizontally scalable, highly available, multi-tenant log aggregation system developed by Grafana Labs, designed to store and query logs in a way that is efficient, cost-effective, and deeply integrated with Grafana dashboards.
Unlike traditional log aggregators (e.g., Elasticsearch + Logstash), Loki is "prometheus-inspired", meaning it organizes logs with labels rather than indexing their full contents, making it much more efficient for many observability use cases.
Use Hedgehog out of the box with Grafana Cloud Logs, or use the Hedgehog API to push network logs to your Grafana Enterprise Loki instance.
Metrics
Scalable Network Metrics Monitoring with Grafana Mimir
Grafana Mimir is a new distributed time series database and monitoring engine developed by Grafana Labs. It is designed to be a long-term, scalable, and cloud-native replacement or complement to Prometheus, with deep integration into Grafana Cloud and modern observability stacks.
While Prometheus is well-established and extremely popular for metrics collection and monitoring, Mimir is built to address some of its limitations, especially around horizontal scalability, global querying, and long-term storage.
Hedgehog pushes network metrics to Prometheus-compatible APIs including Mimir, Thanos, Grafana Cloud, and Influx DB. Hedgehog network metrics include Metrics includes port speeds, counters, errors, operational status, transceivers, fans, power supplies, temperature sensors, BGP neighbors, LLDP neighbors, and more. You can monitor your network metrics in Grafana Cloud Metrics, Grafana Mimir in your Grafana Enterprise instance, or alternatives like Thanos.
Traces
End-to-End Network Traceability for Enhanced Observability
A trace is a record of a single transaction or request as it flows through a system — especially a distributed system or microservices architecture. A trace is composed of spans, each representing a unit of work (e.g., a function call, API request, DB query, or a network flow).
Each span includes metadata like start and end timestamps, tags/attributes (e.g., service name, error status), parent-child relationships between spans. Together, these spans provide a complete timeline and dependency tree of what happened during the execution of a request.
Traces can be particularly useful in AI training where training runs may fail due to large "elephant" network flows that create congestion on the network, degrade GPU utilization and may cause training runs to fail.
Later this year Hedgehog will add network traces to our open telemetry collection so you can analyze network flows in Grafana Cloud Traces or Grafana Tempo in your Grafana Enterprise stack.
